# Rectangles / Circles
Rectangles/circles are placed within Maps and have several props which are derived from Google's Rectangle Options (opens new window) and Circle Options (opens new window).
This component supports the following events:
@bounds-changed(Only rectangles) returns new bounds@center-changed(Only circles) returns new center@radius-changed(Only circles) returns new radius@clickreturns PolyMouseEvent (opens new window)@double-clickreturns PolyMouseEvent (opens new window)@dragreturns MouseEvent (opens new window)@drag-endreturns MouseEvent (opens new window)@drag-startreturns MouseEvent (opens new window)@mouseoverreturns PolyMouseEvent (opens new window)@right-clickreturns PolyMouseEvent (opens new window)
| Props | Type | Default | Description |
|---|---|---|---|
| bounds | Array | required | (Only rectangles) Position of rectangle: { east, north, south, west } (Type: google.maps.LatLngBoundsLiteral) |
| center | Object | required | (Only circles) The center of circle: { lat: number, lng: number } (Type: google.maps.LatLngLiteral) |
| radius | Number | required | (Only circles) The radius in meters on the Earth's surface |
| clickable | Boolean | true | Indicates whether this Polyline handles mouse events |
| draggable | Boolean | false | Allow the shape to be dragged over the map |
| editable | Boolean | false | Allow editing the shape by dragging the control points |
| fillColor | String | black | The fill color *** |
| fillOpacity | Number | 0.3 | The fill opacity between 0.0 and 1.0 |
| strokeColor | String | black | The stroke color *** |
| strokePosition | Number | 0 | The stroke position along the path (0 = CENTER / 1 = INSIDE / 2 = OUTSIDE) |
| strokeOpacity | Number | 1.0 | The stroke opacity between 0.0 and 1.0 |
| strokeWeight | Number | - | The stroke width in pixels |
| visible | Boolean | true | Whether this polyline is visible on the map |
| zIndex | Number | 0 | The zIndex compared to other polys |
*** All CSS3 colors are supported except for extended named colors
<template>
<gmaps-map>
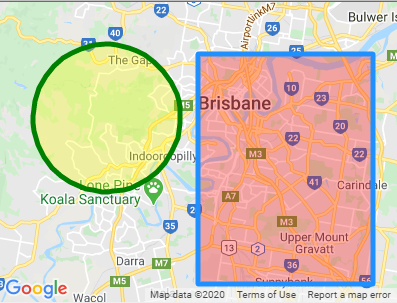
<gmaps-rectangle :bounds="bounds" :strokeColor="blue" :fillColor="red" />
<gmaps-circle
:center="center"
:radius="radius"
:strokeColor="green"
:fillColor="yellow"
/>
</gmaps-map>
</template>
<script>
import { gmapsMap, gmapsRectangle, gmapsCircle } from 'x5-gmaps';
export default {
components: { gmapsMap, gmapsPolyline, gmapsPolygon },
data: () => ({
bounds: {
east: 153.12,
north: -27.44,
west: 153.0,
south: -27.58
},
center: { lat: -27.479, lng: 152.937 },
radius: 5000
})
};
</script>